

Qualitative Research
Access resources tailored to your learning style
Getting Started with Dedoose
Review key features and terminology, data preparation tips, create a project and import data.
Learn More


Review key features and terminology, data preparation tips, create a project and import data.
Learn how to use Dedoose for qualitative and mixed methods data analysis. Access a variety of resources based on your learning style.

Learn how to use Dedoose for qualitative and mixed methods data analysis. Access a variety of resources based on your learning style.
The Learning Center is our most comprehensive resource built to help your users learn everything they need to know about the application.
Dive into the latest news about Dedoose and how researchers around the world are maximizing their analysis.
Learn how to get the most out of Dedoose by attending live webinars, workshops, or conferences. View previous events to access on-demand videos related to data analysis and visualization.
Unpack the math behind Kappa and Pooled Kappa to help understand implications for your study
Drs. Calvert, Quash, & Spindler will discuss key considerations related to AI use.
A guided introduction to dealing with the methodological complexity of mixed methods and qualitative inquiry using Dedoose.
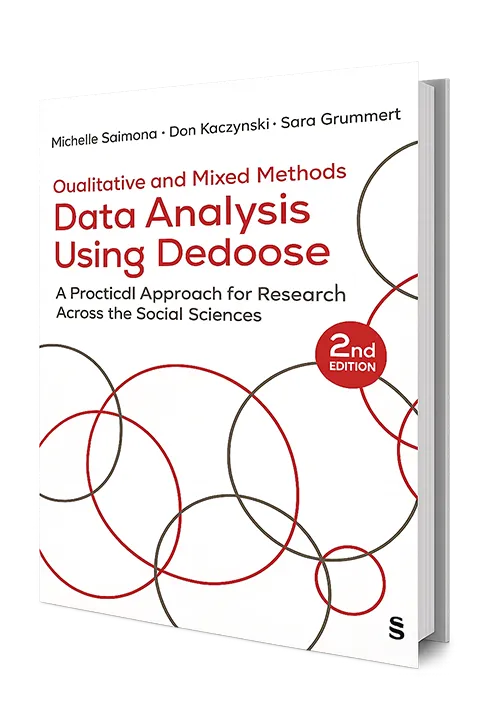
This publication provides both new and experienced researchers with a guided introduction to dealing with the methodological complexity of mixed methods and qualitative inquiry using Dedoose. The authors use their depth of experience designing and updating Dedoose as well as their published research to give the reader practical strategies for using Dedoose from a wide range of research studies. Case study contributions by outside researchers provide readers with rich examples of how to use Dedoose in practical, applied social science and health settings.
Learn about features and updates for each version of Dedoose!
You can view auto-coded excerpts via the Auto-Code History tab. When selecting the number of excerpts in the Excerpts column, Dedoose will present a list of the auto-coded excerpts by excerpt type (new vs modified). Accessing these excerpts allows you to quickly apply more codes or modify the excerpts further without having to return to the original document or view them by code.
You can now choose from 4 different user interface themes – Dedoose Classic, Dedoose, Dark Mode, and High Contrast - via the App Settings icon in the upper right corner of the app.
The most recent update focused on several server-side improvements and small bug fixes. For Premier and Enterprise clients, we have optimized the SSO process and offer both partial-site and full-site single-sign-on integration. Learn more about SSO options by visiting our pricing page and selecting Premier and Enterprise. Happy Dedoosing!
Dedoose 9 comes with significant performance enhancements with updated server-side architecture that will help keep processing speeds high, even if you have several people in your project at once!
With the Account workspace, our focus was to give group administrators more information and control over the groups under their accounts. We have separated the Account workspace’s contents into 4 sections: Account Users, Account Project, Billing, and Security. Each section provides more transparency into users, projects, billing history, and security policies.
Learn Dedoose through short and longform video tutorials. View detailed walkthroughs on our Videos and YouTube pages for how to get started and progress your analysis!

The Learning Center is our most comprehensive resource built to help your users learn everything they need to know about the application.

Dive into the latest news about Dedoose and how researchers around the world are maximizing their analysis.
Learn how to get the most out of Dedoose by attending live webinars, workshops, or conferences. View previous events to access on-demand videos related to data analysis and visualization.
Unpack the math behind Kappa and Pooled Kappa to help understand implications for your study
Drs. Calvert, Quash, & Spindler will discuss key considerations related to AI use.
A guided introduction to dealing with the methodological complexity of mixed methods and qualitative inquiry using Dedoose.
This publication provides both new and experienced researchers with a guided introduction to dealing with the methodological complexity of mixed methods and qualitative inquiry using Dedoose software. The authors use their depth of experience designing and updating Dedoose as well as their published research to give the reader practical strategies for using Dedoose from a wide range of research studies. Case study contributions by outside researchers provide readers with rich examples of how to use Dedoose in practical, applied social science and health settings.
Learn about features and updates for each version of Dedoose!
You can view auto-coded excerpts via the Auto-Code History tab. When selecting the number of excerpts in the Excerpts column, Dedoose will present a list of the auto-coded excerpts by excerpt type (new vs modified). Accessing these excerpts allows you to quickly apply more codes or modify the excerpts further without having to return to the original document or view them by code.
You can now choose from 4 different user interface themes – Dedoose Classic, Dedoose, Dark Mode, and High Contrast - via the App Settings icon in the upper right corner of the app.
The most recent update focused on several server-side improvements and small bug fixes. For Premier and Enterprise clients, we have optimized the SSO process and offer both partial-site and full-site single-sign-on integration. Learn more about SSO options by visiting our pricing page and selecting Premier and Enterprise. Happy Dedoosing!
Dedoose 9 comes with significant performance enhancements with updated server-side architecture that will help keep processing speeds high, even if you have several people in your project at once!
With the Account workspace, our focus was to give group administrators more information and control over the groups under their accounts. We have separated the Account workspace’s contents into 4 sections: Account Users, Account Project, Billing, and Security. Each section provides more transparency into users, projects, billing history, and security policies.
Learn Dedoose through short and longform video tutorials. View detailed walkthroughs on how to get started and progress your analysis!