USER GUIDE
Dedoose is an easy-to-use, collaborative, web based application that facilitates all types of research data management and analysis.
Here's what you need to know about how to use it.
Download full User Guide here:
DownloadBecoming Familiar with Dedoose
The Home Workspace Features
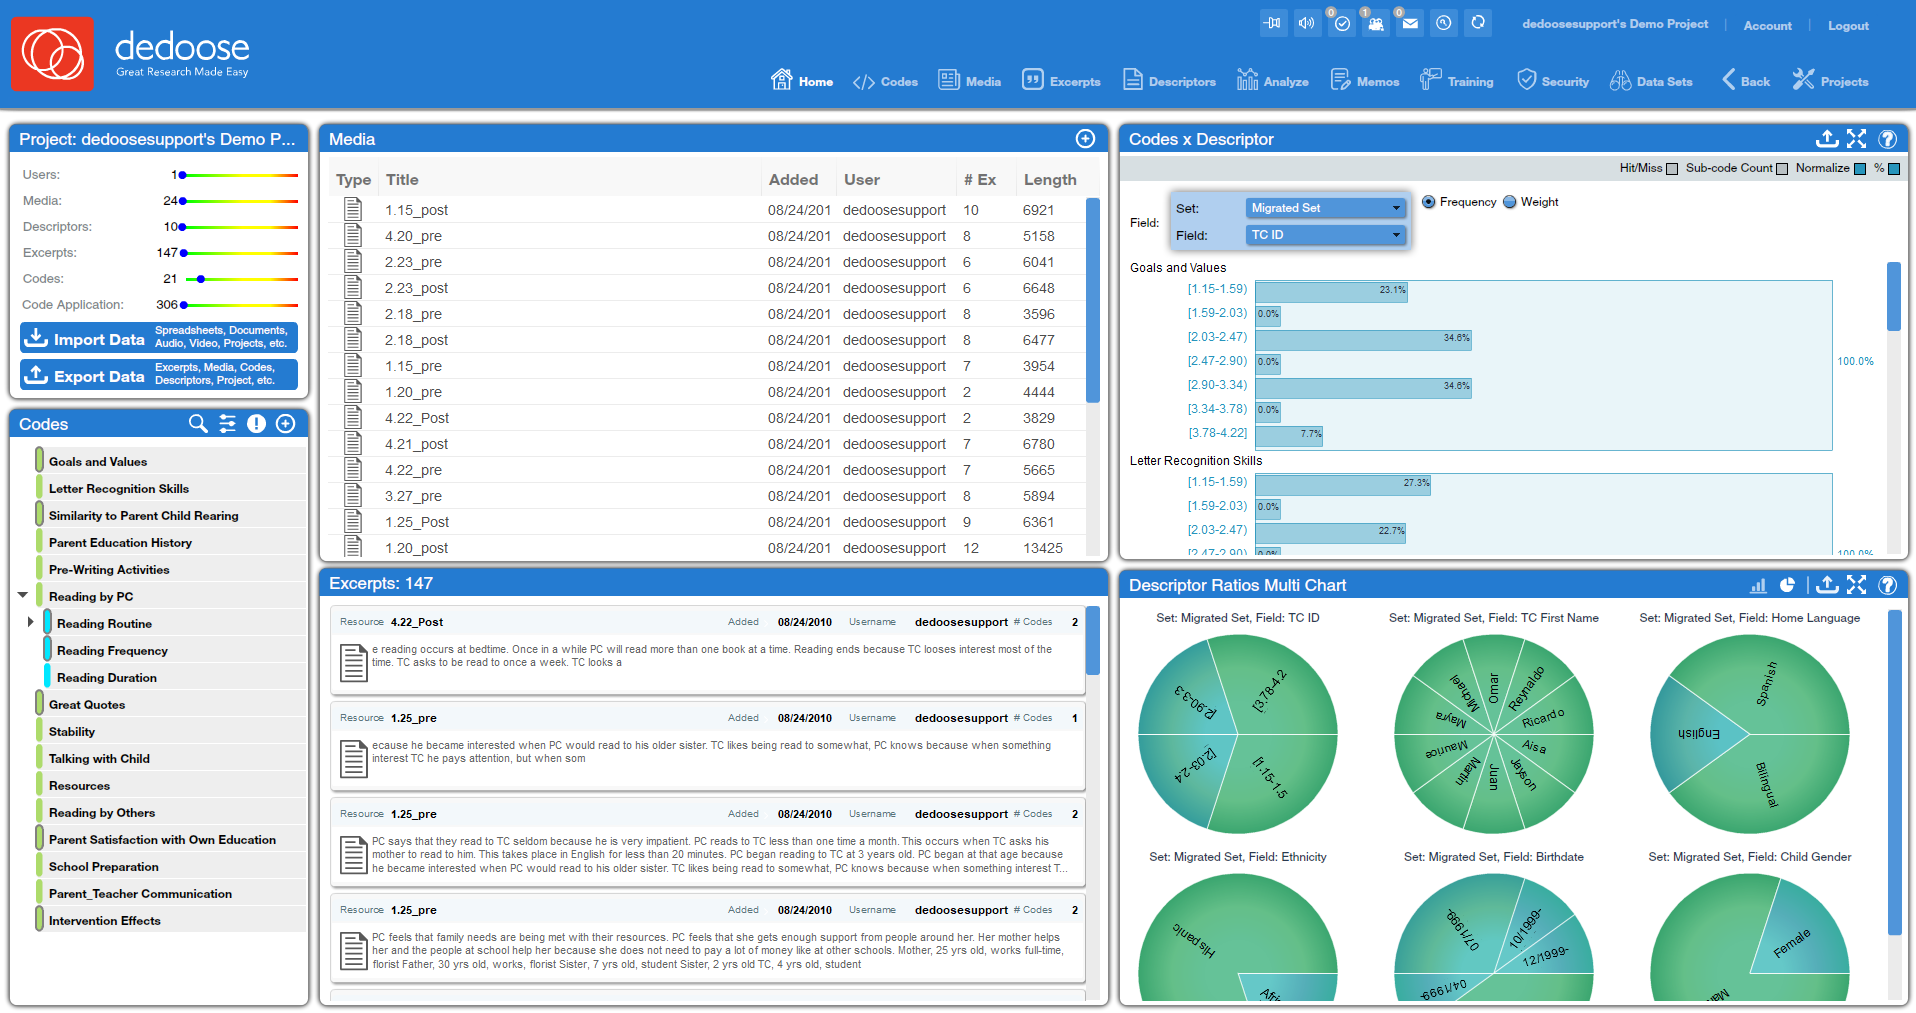
The Home workspace provides an overview of the content of a project. Extra information about items on the Homespace can be fobtained by moving the cursor over these items.
Most items you see on any Dedoose are active: the information or action they represent can be accessed by clicking on them.
• The upper left panel of the Home workspace contains a summary of your project’s attributes and buttons to import and export data. You can also import data to and export data from individual Workspaces by clicking on the Import or Export button at the top of the panel for that Workspace. • The top of some Workspace panels also features an Edit icon. When you click on Edit some panels will turn orange to remind you to switch out of Edit mode when you are finished editing. • You can expand individual Workspaces (charts, tables, plots) to full screen by clicking the Expand icon. When you are done, simply close that window by clicking the X to close. • When you move your cursor over different icons or objects in the Project, Smart Tool Tips will pop up to answer questions you may have.
If you are using Dedoose for the first time, Dedoose will open on the Demo project, a mixed methods study of literacy development. The Demo aims to provide the opportunity to explore Dedoose and see what can be done in Dedoose.
Returning users will see the project they most recently visited.
To create a new project or to access another project, you need to open the Project homespace by clicking on the Project Tab in the Main Menu bar.
The Main Menu Bar
 Located at the top, it allows to access different workspaces within the open project. The Back button allows to go back in Dedoose.
Saving Your Work
Generally, data submitted to a Dedoose project are automatically saved in real-time so you never have to worry about losing data. Uploading media, creating and tagging excerpts, linking media to descriptors... do not require any active 'save' action.
Saving is only required when syncing transcript sections to excerpts on video and audio streams, when creating or editing a text file, and after writing a memo. A Save button will pop up when you are required to save.##!image
Logging out of Dedoose is as simple as clicking the logout button in the Dedoose header.
It is still a good idea to create backup copies of your work. You will find more information about this process in Backing Up and Managing Your Data Blog
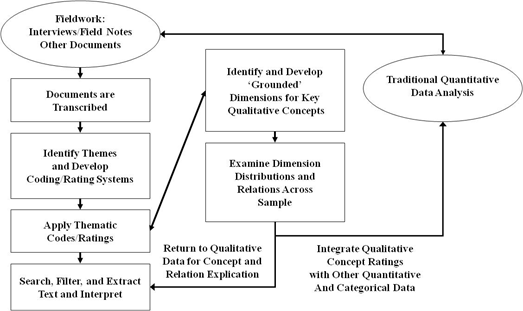
Combining and Analyzing Mixed Method Data
Let's begin here by looking at a picture of one way qualitative and quantitative data can be linked together. The left column illustrates the flow from 'Fieldwork' to 'Generate New Themes,' summarizes much of what takes place in basic qualitative research. On the other hand, the more logical positivist (or empiricist) rules for quantitative research are more tightly constrained by guidelines for how data are to be collected, hypotheses defined, planned analyses, and results reported. But, if the questions under study can be better represented by both types of data, we need ways to bring them in touch with each other so more complex questions can be considered during analysis. In this exemplar model, ratings or dimensions of qualitative themes are generated, explored, and integrated with other quantitative data. By doing so, they serve as a mechanism for moving back and forth between the two types of data and allow easy access to the best evidence for particular questions - sometimes qualitative, sometimes quantitative, and sometimes both. In Dedoose, these ratings are the codes weights/ratings that Dedoose uses to build visualizations that expose patterns in these complex relationships (Lieber & Weisner, 2010, 'Meeting the practical challenges of mixed methods research.' In A. Tashakkori & C. Teddlie (Eds.) Sage Handbook of Mixed Methods in Social & Behavioral Research, 2nd Edition (pp. 559-579). Thousand Oaks, CA: SAGE Publications).
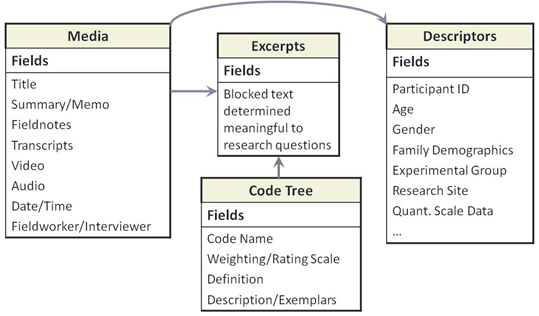
How Dedoose Connects these Data
This next figure shows the basic architecture of a Dedoose relational database and how the various aspects of the mixed methods database are connected. Through a set of relationships every piece of information is connected: from media to descriptors, excerpts to media, and codes/tags and tag weights/ratings to excerpts. These relationships allow Dedoose analytic features to use any and every piece of information how the data are displayed, filtered, analyzed, and exported.